Menu

Bug Map

The Bug Map plots located bug reports onto a top-down image of your game’s map. Instead of reading through a list, you see where problems happen — a heatmap of clusters, hotspots you can click into, and filters to narrow down by category, area, or date.

It’s built for games that already know where a report came from — a level, a zone, an (X, Y) position — whether players pick the spot themselves or your game sends coordinates automatically.
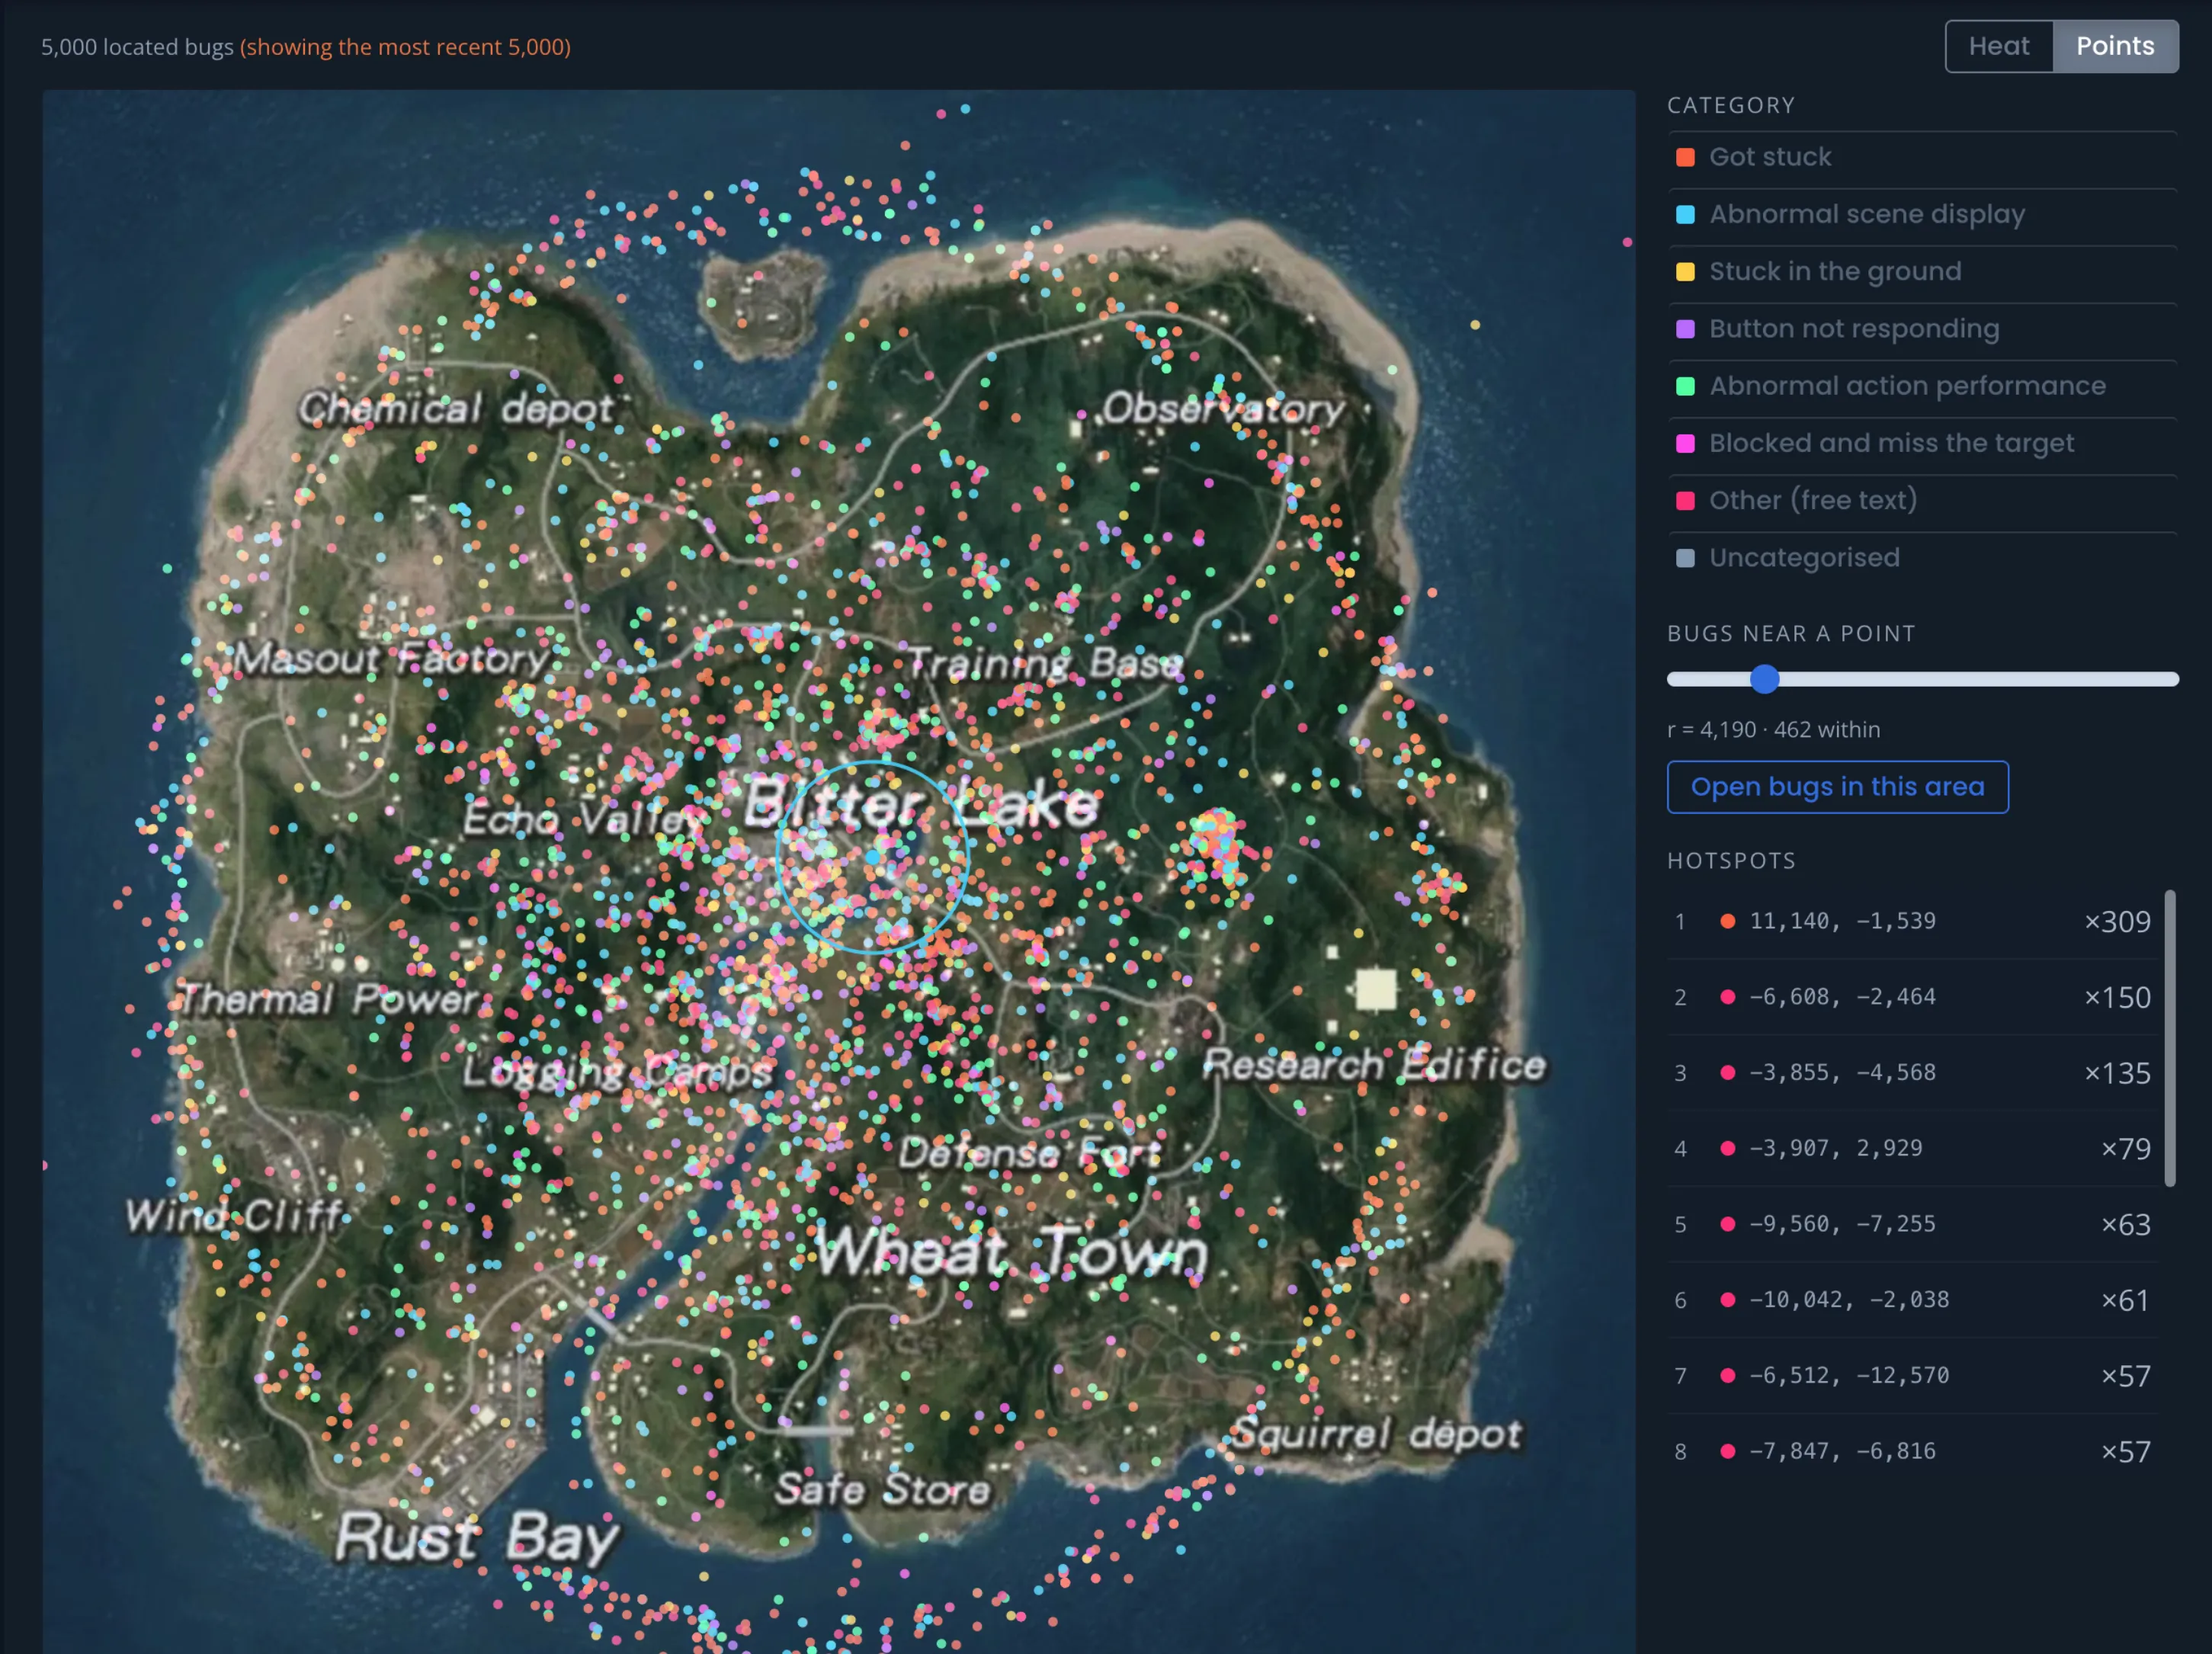
Bug Map in Points mode: thousands of category-coloured dots plotted across a battle-royale island map, with a category legend, a radius tool, and a ranked hotspot list
The Bug Map in Points mode — 5,000 located reports from Rules of Survival: Legacy, coloured by category. Shared with permission.

How It Works

  1. Turn on the **Maps module** — it’s off by default; enable it in your project settings.
  2. Add and align a map — upload a top-down image and tell BetaHub which world coordinates it covers, so a report’s position becomes a pin.
  3. Add a **Coordinates field** — a custom field that captures a report’s location. Players pin it on the map when reporting, or your game/integration sends it.
  4. Open the **Bug map** — every located report now plots onto the matching map.

Turning On Maps

Maps is a project module and is off by default. To enable it, go to Settings → Edit Project, find the Features & Modules section, and check Maps (“Enable this module to plot bugs and telemetry as coordinates on your game maps and see where problems cluster.”).

Once enabled, two new places appear for developers: Maps under Settings → Edit Project’s Settings menu (for managing maps), and a top-level Bug map item (the view itself).

Adding and Aligning a Map

Go to Settings → Maps and choose Add map. Each map needs:

  • Name — shown to your team in the map list and on each bug (e.g. Xiutz).
  • Client map id — the map id your game sends with each report (e.g. 700). Reports carrying this id plot onto this map. If players place pins by hand rather than your game sending them, this is simply the id you’ll associate with locations on this map.
  • Map image — a top-down image of the map. PNG, JPEG, or WebP, up to 10 MB.

Alignment

Alignment tells BetaHub which world coordinates the image covers, so a report’s raw X, Y turns into a pin in the right spot. There are two methods, both under Align to world coordinates:

  • Edge bounds — type the world coordinates at each edge of the image: Min X (left), Max X (right), Min Y (bottom), Max Y (top). Use this when the image edges are the play-area bounds.
  • 2-point calibration — click the map to drop two points, then type each point’s real world X and Y. Use this when the play area doesn’t sit exactly at the image edges (letterboxing, borders, an inset minimap). This is the more forgiving method.

Until a map is aligned it shows a Needs alignment badge and won’t plot pins; once aligned it shows Aligned. A map’s plotted coordinates are kept even if you remove the map — they just stop showing until another map covers them.

Capturing a Report’s Location

Locations live in a **Coordinates** custom field. Create one under Settings → Custom Fields: add a field and pick Coordinates (map location) as the field type. (This type only appears once the Maps module is on, since a coordinate only means something with a map to plot it on.)

With a Coordinates field in place, a report’s location can be set two ways:

  • Players pick it — on the bug report form, a map appears with the prompt “Click the map to place this bug’s location.” The reporter clicks the spot and a pin drops. Tick Players can set this field on the field so reporters can use it.
  • Your game or integration sends it — the BetaHub API accepts a coordinate with each submission (a map id plus X and Y). This is how high-volume, automatic reports get their location without anyone clicking. See API Access.

On a bug’s page, a located field shows the map with the pin and a readout of the map name and coordinates.

Reading the Bug Map
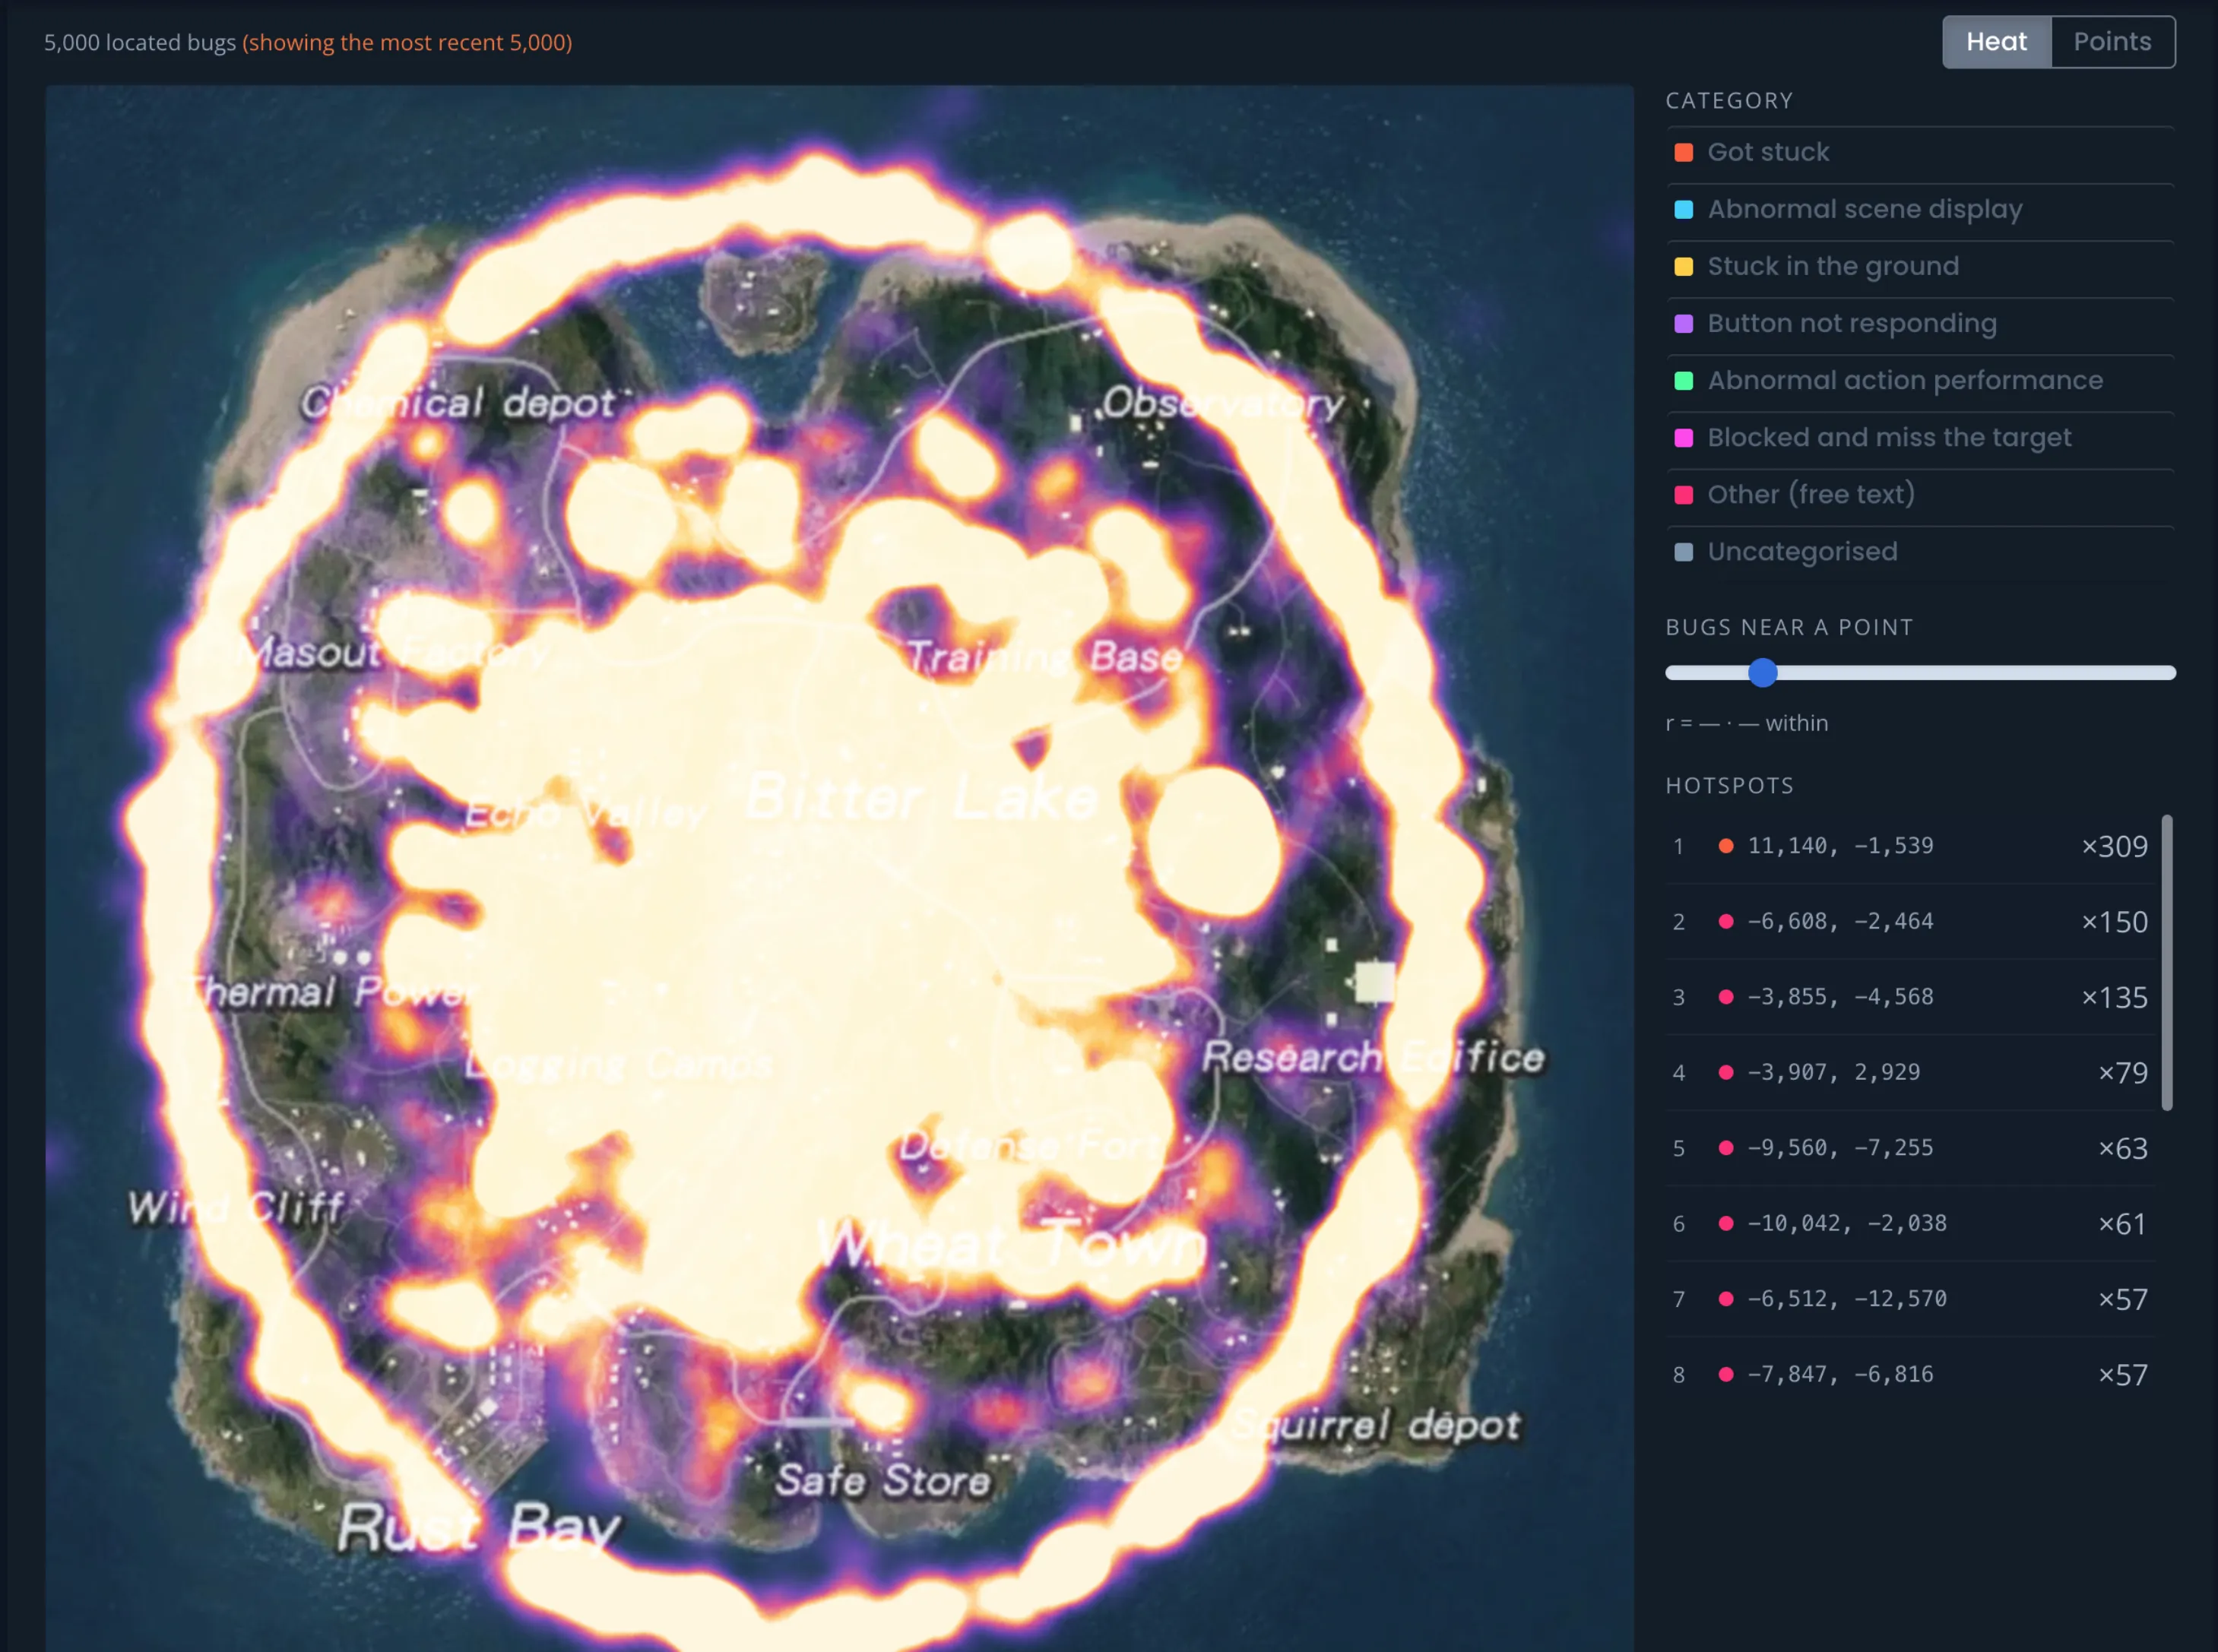
The same map in Heat mode: bright hotspots glow where bug reports concentrate, with a ring of density around the island's playable edge
The same reports in Heat mode — clusters glow where problems concentrate. From Rules of Survival: Legacy, shared with permission.

Open the Bug map to see every located report on the current map. The controls:

  • Heat / Points — switch between a density heatmap and individual dots. Heat is best for spotting clusters; Points for seeing each report.
  • Category — the legend colours reports by your first single-choice custom field (plus an Uncategorised bucket). Toggle a category on or off, use All / None, or only to isolate one.
  • Hotspots — the busiest clusters are listed with a count. Click a hotspot to open Bugs at this location — the actual list of reports there.
  • Bugs near a point — click the map to drop a centre, then drag the radius slider; Open bugs in this area lists every report inside that circle.
  • From / To — filter to reports created in a date range; Apply to set it, Clear to remove it.
  • Show N — choose how many reports to render (1,000 up to 25,000). The most recent are shown first; the default is 5,000.
  • Pan & zoom — drag to pan, scroll to zoom, or use the + / − / reset controls, just like an online map.

From any bug list that opens over the map, Open in full view takes you to the full issues list scoped to that same area and dates.

If more than one aligned map exists, a map selector lets you switch between them.

Raw Reports vs. Regular Bugs

Not every located report is a bug someone should read. A game can send a huge volume of automatic, low-detail signals — a player tapped “I’m stuck”, a telemetry ping — that are valuable in aggregate on the map but would bury your real bug list.

BetaHub handles this with a raw flag on a report:

  • A regular bug behaves normally: it appears in your bugs list, gets AI triage and duplicate detection, and notifies your team. If it has a location, it also shows on the Bug Map.
  • A raw report is treated as telemetry: it’s kept out of the bugs list, search, and public boards, skips all AI processing and notifications, and shows up only on the Bug Map (and when you filter the issues list to a map area).

This lets the map hold tens of thousands of signals while your bugs list stays focused on reports worth acting on. Whether a report is raw is chosen at submission time through the API — see API Access.

Plan Limits

The number of maps per project depends on your plan:

  • Free / basic — up to 2 maps per project.
  • Standard, Pro, and higher — unlimited maps.

Where to Find It

  • Enable it: Settings → Edit ProjectFeatures & ModulesMaps
  • Manage maps: Settings → Maps
  • View the map: the Bug map item in the project sidebar

See Also

  • Custom Fields – Define the fields, including Coordinates, that reports carry
  • API Access – Submit locations and the raw flag, and read structured fields back
  • Managing Feedback – Triage, assign, and act on the reports you find on the map
  • Public Bug Board – Share a public bug list (raw reports are never shown there)

Bug Map

The Bug Map plots located bug reports onto a top-down image of your game’s map. Instead of reading through a list, you see where problems happen — a heatmap of clusters, hotspots you can click into, and filters to narrow down by category, area, or date.

It’s built for games that already know where a report came from — a level, a zone, an (X, Y) position — whether players pick the spot themselves or your game sends coordinates automatically.

Bug Map in Points mode: thousands of category-coloured dots plotted across a battle-royale island map, with a category legend, a radius tool, and a ranked hotspot list
The Bug Map in Points mode — 5,000 located reports from Rules of Survival: Legacy, coloured by category. Shared with permission.

How It Works

  1. Turn on the **Maps module** — it’s off by default; enable it in your project settings.
  2. Add and align a map — upload a top-down image and tell BetaHub which world coordinates it covers, so a report’s position becomes a pin.
  3. Add a **Coordinates field** — a custom field that captures a report’s location. Players pin it on the map when reporting, or your game/integration sends it.
  4. Open the **Bug map** — every located report now plots onto the matching map.

Turning On Maps

Maps is a project module and is off by default. To enable it, go to Settings → Edit Project, find the Features & Modules section, and check Maps (“Enable this module to plot bugs and telemetry as coordinates on your game maps and see where problems cluster.”).

Once enabled, two new places appear for developers: Maps under Settings → Edit Project’s Settings menu (for managing maps), and a top-level Bug map item (the view itself).

Adding and Aligning a Map

Go to Settings → Maps and choose Add map. Each map needs:

  • Name — shown to your team in the map list and on each bug (e.g. Xiutz).
  • Client map id — the map id your game sends with each report (e.g. 700). Reports carrying this id plot onto this map. If players place pins by hand rather than your game sending them, this is simply the id you’ll associate with locations on this map.
  • Map image — a top-down image of the map. PNG, JPEG, or WebP, up to 10 MB.

Alignment

Alignment tells BetaHub which world coordinates the image covers, so a report’s raw X, Y turns into a pin in the right spot. There are two methods, both under Align to world coordinates:

  • Edge bounds — type the world coordinates at each edge of the image: Min X (left), Max X (right), Min Y (bottom), Max Y (top). Use this when the image edges are the play-area bounds.
  • 2-point calibration — click the map to drop two points, then type each point’s real world X and Y. Use this when the play area doesn’t sit exactly at the image edges (letterboxing, borders, an inset minimap). This is the more forgiving method.

Until a map is aligned it shows a Needs alignment badge and won’t plot pins; once aligned it shows Aligned. A map’s plotted coordinates are kept even if you remove the map — they just stop showing until another map covers them.

Capturing a Report’s Location

Locations live in a **Coordinates** custom field. Create one under Settings → Custom Fields: add a field and pick Coordinates (map location) as the field type. (This type only appears once the Maps module is on, since a coordinate only means something with a map to plot it on.)

With a Coordinates field in place, a report’s location can be set two ways:

  • Players pick it — on the bug report form, a map appears with the prompt “Click the map to place this bug’s location.” The reporter clicks the spot and a pin drops. Tick Players can set this field on the field so reporters can use it.
  • Your game or integration sends it — the BetaHub API accepts a coordinate with each submission (a map id plus X and Y). This is how high-volume, automatic reports get their location without anyone clicking. See API Access.

On a bug’s page, a located field shows the map with the pin and a readout of the map name and coordinates.

Reading the Bug Map

The same map in Heat mode: bright hotspots glow where bug reports concentrate, with a ring of density around the island's playable edge
The same reports in Heat mode — clusters glow where problems concentrate. From Rules of Survival: Legacy, shared with permission.

Open the Bug map to see every located report on the current map. The controls:

  • Heat / Points — switch between a density heatmap and individual dots. Heat is best for spotting clusters; Points for seeing each report.
  • Category — the legend colours reports by your first single-choice custom field (plus an Uncategorised bucket). Toggle a category on or off, use All / None, or only to isolate one.
  • Hotspots — the busiest clusters are listed with a count. Click a hotspot to open Bugs at this location — the actual list of reports there.
  • Bugs near a point — click the map to drop a centre, then drag the radius slider; Open bugs in this area lists every report inside that circle.
  • From / To — filter to reports created in a date range; Apply to set it, Clear to remove it.
  • Show N — choose how many reports to render (1,000 up to 25,000). The most recent are shown first; the default is 5,000.
  • Pan & zoom — drag to pan, scroll to zoom, or use the + / − / reset controls, just like an online map.

From any bug list that opens over the map, Open in full view takes you to the full issues list scoped to that same area and dates.

If more than one aligned map exists, a map selector lets you switch between them.

Raw Reports vs. Regular Bugs

Not every located report is a bug someone should read. A game can send a huge volume of automatic, low-detail signals — a player tapped “I’m stuck”, a telemetry ping — that are valuable in aggregate on the map but would bury your real bug list.

BetaHub handles this with a raw flag on a report:

  • A regular bug behaves normally: it appears in your bugs list, gets AI triage and duplicate detection, and notifies your team. If it has a location, it also shows on the Bug Map.
  • A raw report is treated as telemetry: it’s kept out of the bugs list, search, and public boards, skips all AI processing and notifications, and shows up only on the Bug Map (and when you filter the issues list to a map area).

This lets the map hold tens of thousands of signals while your bugs list stays focused on reports worth acting on. Whether a report is raw is chosen at submission time through the API — see API Access.

Plan Limits

The number of maps per project depends on your plan:

  • Free / basic — up to 2 maps per project.
  • Standard, Pro, and higher — unlimited maps.

Where to Find It

  • Enable it: Settings → Edit ProjectFeatures & ModulesMaps
  • Manage maps: Settings → Maps
  • View the map: the Bug map item in the project sidebar

See Also

  • Custom Fields – Define the fields, including Coordinates, that reports carry
  • API Access – Submit locations and the raw flag, and read structured fields back
  • Managing Feedback – Triage, assign, and act on the reports you find on the map
  • Public Bug Board – Share a public bug list (raw reports are never shown there)
BetaHub Help
AI